Understanding Normal Distribution: Definition, Formula, Examples, and Applications in Statistics
Normal distribution is a fundamental concept in statistics, often referred to as the Gaussian distribution. It plays a crucial role in various fields, including psychology, finance, and natural sciences. This blog post will explore the definition, formula, examples, and applications of normal distribution, ensuring a comprehensive understanding for readers.
What is Normal Distribution?
Normal distribution is a probability distribution that is symmetric about the mean, indicating that data near the mean are more frequent in occurrence than data far from the mean. It is characterized by its bell-shaped curve, which is defined by two parameters: the mean (µ) and the standard deviation (σ).
Key Characteristics of Normal Distribution:
- Symmetry: The left and right sides of the curve are mirror images.
- Mean, Median, and Mode: In a normal distribution, these three measures of central tendency are all equal and located at the center of the distribution.
- Empirical Rule: Approximately 68% of the data falls within one standard deviation from the mean, about 95% falls within two standard deviations, and around 99.7% falls within three standard deviations.
The Formula of Normal Distribution
The probability density function (PDF) of a normal distribution is given by the formula:

Where:
- f(x) is the height of the curve at point x,
- μ is the mean,
- σ is the standard deviation,
- e is the base of the natural logarithm (approximately equal to 2.71828),
- π is a mathematical constant (approximately equal to 3.14159).
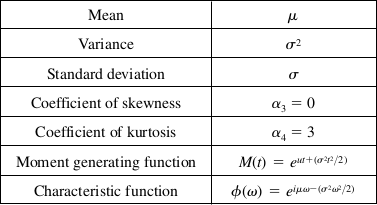
Some Properties of the Normal Distribution

Examples of Normal Distribution
Heights of People:
In a population, if we measure the heights of adults, we often find that they follow a normal distribution. Most people have a height close to the average, with fewer individuals being much shorter or taller.
Test Scores:
Standardized test scores, such as the SAT, are usually normally distributed. Most students score near the average, while a smaller number achieve very high or very low scores.
Measurement Errors:
In scientific experiments, the errors in measurement often follow a normal distribution. This is because the errors can be caused by a variety of small, random factors.
Applications of Normal Distribution
Normal distribution has several important applications across different fields:
Statistical Inference:
It forms the basis for many statistical tests and confidence interval calculations. The central limit theorem states that, under certain conditions, the sum of a large number of random variables will be normally distributed.
Quality Control:
In manufacturing, quality control processes often use normal distribution to determine if products meet specifications. By monitoring the mean and standard deviation, companies can maintain product quality.
Finance:
Investors use normal distribution to model the returns of assets. It helps in assessing risk and making informed investment decisions.
Psychology:
Normal distribution is often used to analyze psychological test scores and intelligence quotient (IQ) scores, providing insights into cognitive abilities within a population.
Example
Problem: The heights of adult men in a city are normally distributed with a mean height of 70 inches and a standard deviation of 3 inches. What percentage of men are taller than 73 inches?
Solution:
- Calculate the z-score for 73 inches: z=(X−μ)/σ=(73−70)3=1
- Look up the z-score in a standard normal distribution table. A z-score of 1 corresponds to approximately 0.8413. This means about 84.13% of men are 73 inches or shorter.
- To find the percentage taller than 73 inches: 1−0.8413=0.1587 or 15.87%
Problem: A manufacturing process produces metal rods with a mean length of 50 cm and a standard deviation of 2 cm. What is the probability that a randomly selected rod is between 48 cm and 52 cm?
Solution:
Calculate the z-scores for 48 cm and 52 cm:
z48=(48−50)2=−1
z52=(52−50)2=1
- Look up the z-scores:
- For z48=−1: approximately 0.1587
- For z52=1: approximately 0.8413
The probability of the rod being between 48 cm and 52 cm:
=0.8413−0.1587=0.6826 or 68.26%
Good content