Have you ever delved into a dataset and wondered how individual values relate to the central tendency? Z-scores, also known as z-statistics, come to the rescue in statistics, offering a powerful metric to quantify this connection. This blog post unveils the mysteries of z-scores, guiding you through their definition, formula, and practical applications.
Defination Of Z – Score
Imagine a collection of data representing exam scores for a biology class. A z-score tells you precisely how many standard deviations a particular student’s score deviates from the class average (mean).
- A z-score of 0 indicates the student’s score aligns perfectly with the average.
- A positive z-score (e.g., +1.7) signifies the student scored 1.7 standard deviations higher than the mean.
- Conversely, a negative z-score (e.g., -2.3) signifies the student scored 2.3 standard deviations lower than the average.
Here, the concept of standard deviation, another crucial statistical measure, plays a vital role. It reflects how spread out the data points are around the mean. A higher standard deviation suggests scores are more scattered, while a lower standard deviation indicates scores are clustered closer to the mean.
Formula Of Z-Score
The magic behind the z-score lies in a straightforward formula:
z = (X – μ) / σ
- z represents the z-score you’re calculating.
- X signifies the specific data point (e.g., a student’s exam score).
- μ (mu) denotes the population mean (average score of all students if we had data for everyone).
- σ (sigma) represents the population standard deviation (spread of scores if we had data for everyone).
Important Note: In real-world scenarios, we often work with samples (a smaller group representing the larger population) instead of the entire population. In such cases, we estimate the population mean and standard deviation using the sample mean (average of the sample scores) and sample standard deviation, respectively.
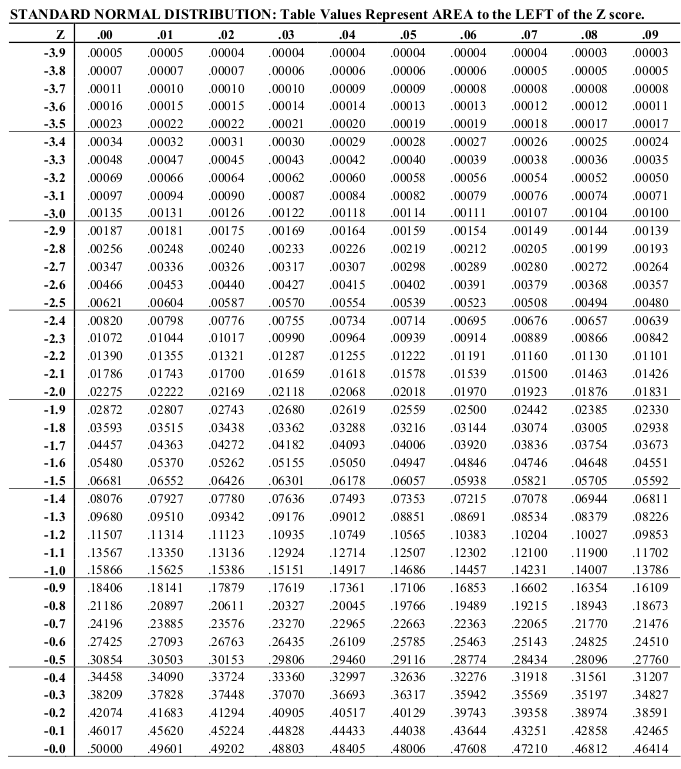
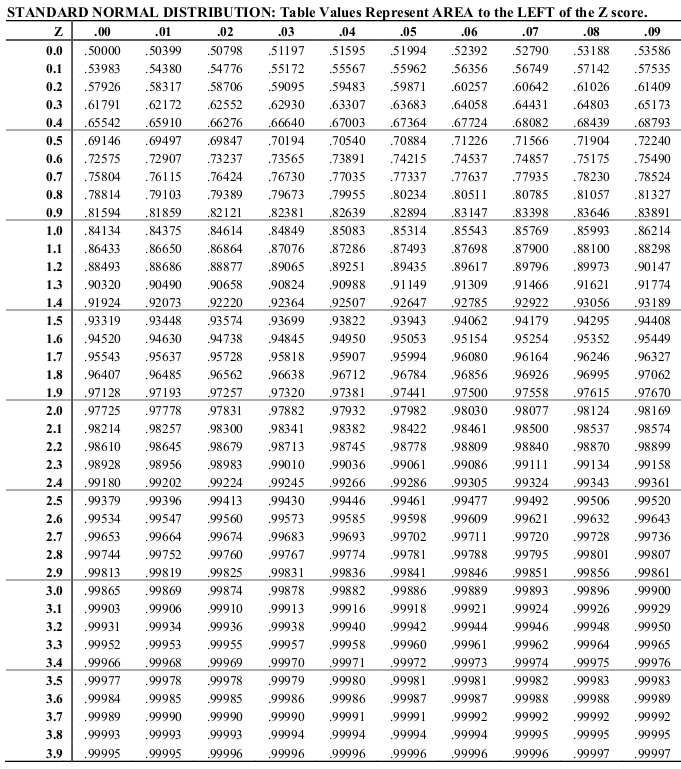
Z-table


Example
Scenario:You’re a teacher analyzing student performance on a recent history quiz. The class average score was 82 points, and the standard deviation was 4 points. One student, Sarah, scored 94 points.
Question: How many standard deviations above the average is Sarah’s score?
Solution:
- Utilize the z-score formula: z = (X – μ) / σ
- Plug in the known values: z = (94 points – 82 points) / 4 points
- Calculate the z-score: z = 12 points / 4 points = 3
Interpretation: Sarah’s score of 94 points is 3 standard deviations above the class average. This signifies an exceptional performance compared to her classmates.
Question: Comparing Fitness Trackers
You’re testing two different fitness trackers to see how many steps they record on average. You wear both trackers for a week and record the daily step count.
- Tracker A: Average daily steps – 8,000, Standard deviation – 200 steps
- Tracker B: Average daily steps – 7,500 steps, Standard deviation – 300 steps
On one particular day, Tracker A recorded 8,400 steps, while Tracker B recorded only 6,800 steps. Which tracker deviated more significantly from its average daily steps?
Solution:
To determine which tracker deviated more, we need to calculate the z-scores for both trackers:
-
Tracker A: z = (8,400 steps – 8,000 steps) / 200 steps = 0.2
-
Tracker B: z = (6,800 steps – 7,500 steps) / 300 steps = -2.33
Interpretation:
Tracker B has a z-score of -2.33, indicating it recorded 2.33 standard deviations below its average daily steps. In comparison, Tracker A’s z-score of 0.2 suggests it only deviated 0.2 standard deviations above its average.
Therefore, Tracker B deviated more significantly from its average daily steps on that particular day.
Z-Scores in Action: Exploring Applications :
Z-statistics hold immense value across various statistical analyses. Here are some key applications:
-
Hypothesis Testing: Z-tests, a type of hypothesis test, leverage z-scores to assess if a difference between a sample mean and a hypothesized value (e.g., the average score in this class is higher than the national average biology score) is statistically significant.
-
Standardizing Scores: Z-scores allow for comparing data points from different datasets, even if they have varying units or scales. This is particularly useful when analyzing data collected from diverse sources, such as exam scores from different schools.
-
Identifying Outliers: Z-scores can help identify outliers, data points that significantly deviate from the rest. Examining these outliers can reveal underlying factors or errors within the data, prompting further investigation.
Conclusion: Z-Scores – Your Key to Unlocking Data Insights
By understanding z-statistics, you gain a powerful tool to delve deeper into the world of data analysis. By quantifying a data point’s position relative to the mean, z-scores unlock numerous possibilities for exploring patterns, drawing comparisons across datasets, and making informed decisions based on your data.
So, the next time you work with data, remember the z-score! It can be your key to unlocking valuable insights hidden within.
Nice content sir